 Density and Diversity: A National Trend
Downtowns across the United States are thriving. From Boston to San Diego, Seattle to Miami, cities are diversifying their economies and land use, restoring and enlivening public spaces. During the last three decades, city centers have been adding arts, culture, dining, education, medical, and research institutions, along with hospitality, leisure, and sports venues. Simultaneously, there has been a dramatic and sustained increase in residents, living both within business districts and adjacent neighborhoods.
Places once shunned as empty and unsafe at night are being redeveloped at higher density and are thriving after dark. They have become preferred places for work, entertainment, and living. Patrons of downtown regional destinations mingle with office workers, resident young professionals, empty-nesters, and, in many cities, an expanding number of families with children. The trends of diversification, animation, and residential revival are occurring as well on and around urban colleges, universities, medical centers, research parks, and other urban commercial zones.
Downtown revitalization has been written about extensively. But it has proved difficult to arrive at standard definitions that make it easy to quantify and compare employment and population trends across the broad range of American cities. A relatively new data-merging and mapping effort from the U.S. Census Bureau and state labor market information (LMI) agencies, called the Local Employment Dynamics data and OntheMap, now make it possible to conclude:
- While employment across the United States has been decentralizing for decades¹ and now averages only 0.05 jobs per acre (34.1 jobs per square mile), 28 major urban employment centers have achieved densities in excess of 100 jobs per acre, while another 24 have between 75 and 99 jobs per acre. (See Appendix II, Table 1 in the report for all 150 cities and their 231 job nodes and Table 2 for Job Densities.)
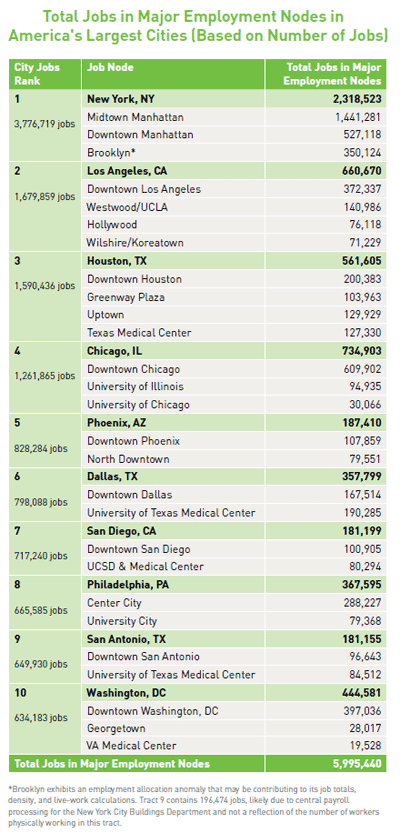
- Total wage and salaried employment in America’s 150 largest cities² (on the basis of jobs) now accounts for 30% of all wage and salaried employment in the United States (38,883,551 jobs). Within these cities, the one-mile area surrounding and including the 231 densest job nodes accounts for 48.1% of the jobs in these cities. (See above figure and Appendix II, Table 1 in the report.) These 231 major employment nodes and the one-mile area surrounding them thus hold 14.4% of U.S. jobs (18,696,018 jobs).
- Major employment centers vary greatly across the country based on local industry specialization, but in the 150 largest cities, employment centers may be broadly grouped into three categories:
- Nearly two-thirds are commercial downtowns and town centers filled with professional, business, insurance, and financial services firms; real estate, communications, energy, and technology employers; as well as leisure, retail, and hospitality industries.
- Twenty percent are education, healthcare, and research campuses with classrooms, dormitories, administrative buildings, museums, hospital beds, doctors’ offices, treatment centers, and laboratories, termed here anchor institution districts.
- Office and research parks in suburban-style, auto-oriented campuses make up the balance.
- American cities vary greatly in terms of the geographic distribution of their economic activity. In general, the cities studied here are one of four types:
- Sixty-one percent are cities with one dominant downtown employment node.
- Thirteen percent have a dominant downtown employment node, plus a significant secondary employment node, typically built around one or more educational or medical facilities.
- Cities with multiple, roughly equal, employment nodes account for 8% of the sample.
- Ten percent are cities with decentralized employment throughout the city area.
In these 231 major employment centers and within the one-mile radius that surrounds each of them, 12.9 million people (4.2% of the U.S. population) now make their primary residence in live-work environments that define thriving 21st century cities.
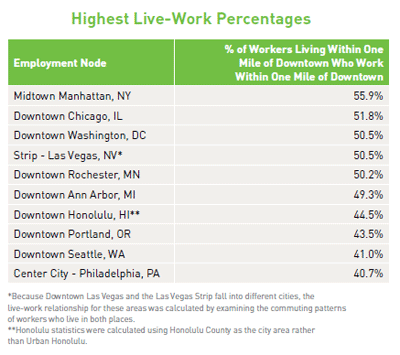
 Employment Nodes with the Highest Live-Work Percentages
A live-work environment is one in which commuting times and costs are significantly reduced. (Contrast a 50-minute commute by car with a 15-minute walk to work.) Thirty-four major, urban employment nodes are at the center of zones in which 30% or more of the working residents living within these employment centers, or within the surrounding one-mile radius, also work within this area. Another 58 major, urban employment nodes are at the center of zones in which 20% to 29% of working residents living within these employment centers, or within the surrounding one-mile radius, work within this area. Five employment centers— Midtown Manhattan, downtown Chicago, downtown Washington, DC, Las Vegas’ major casino strip, and Rochester, MN — have live-work quotients in their downtown residential neighborhoods in excess of 50%. (See Appendix II, Table 3 in the report for all 150 cities and 231 job nodes.)
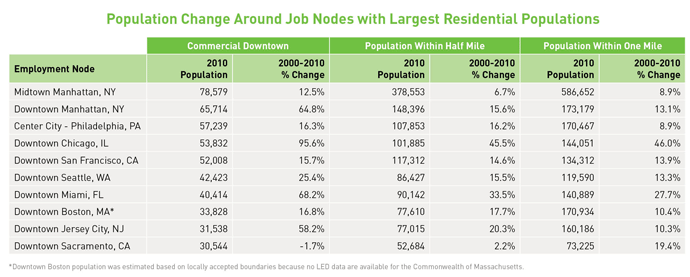
Downtowns with the Largest Number of Residents
In many major cities, the residential population living in and within a mile of major employment zones is growing faster than the rest of the city, sometimes faster than adjacent suburbs. Between 2000 and 2010, nearly all of the most heavily populated downtowns saw double-digit population growth in and around their city centers, with Chicago doubling population in its downtown core. Population growth in and within a one-mile area of each of these 10 downtowns grew an average of 17.2% between 2000 and 2010, while the national population grew by 9.7% in this decade.

These findings are based on 2011 LED data and 2010 Decennial Census data, the most recent years for which the LED employment and full census counts are available. These complete counts, rather than more recent estimates, were used to ensure comparability across geographic areas.³ However, the Census Bureau’s Population Estimates program, as well as the anecdotal evidence from local real estate trends, suggest that downtown population numbers are steadily increasing, and, as the national economy continues to recover, jobs are being added. Between the 2010 Census on April 1, 2010, and July 1, 2012 (the date of the Census Bureau’s most recent population estimates), the top 10 cities featured in this report added an estimated 532,525 people, or 2.2%, to their total population, with Washington, D.C. posting the largest growth rate at 5.1% citywide. As long as energy costs remain high and demographic, cultural, and development trends favoring cities continue, the resurgence of downtowns and anchor institution districts is likely to grow stronger.
But nothing is guaranteed about their success. Sustained economic growth requires focused place management, competitive tax policies, entrepreneurial talent, capital, smart local governance, workforce quality, and good global connections. LED provides a new resource for downtown managers and civic leaders to benchmark their progress on this path. It would be extraordinarily helpful to those who manage, govern, or develop in these places if the U.S. Census Bureau could adopt this methodology for future reports on downtowns and other urban employment nodes.
¹ Elizabeth Kneebone, Job Sprawl Revisited: The Changing Geography of Metropolitan Employment, Brookings Institution, April 2009.
² Throughout this study, the term “city” is used explicitly to refer to the political boundaries of incorporated cities and does not refer to broader metro areas. This study examined 148 of the largest American cities, based on number of jobs, and also includes Arlington and Tyson’s Corner, Virginia, two Census Designated Places (CDPs), a term the Census Bureau uses for settled concentrations of population identifiable by name but not legally incorporated under the laws of the states in which they are located. Las Vegas is a unique situation in which Paradise CDP and Winchester CDP were combined with the incorporated boundaries for the City of Las Vegas in order to capture the major employment nodes downtown and along the Strip.
³ See “Appendix IV, About the Data” in the report, for more information.

